

Cost of Capital Methods
Introduction
Calculating the cost of capital is a critical step to come up with an accurate valuation, but many analysts and investors find the process daunting. As much art as science, there are multiple ways to calculate the cost of capital and just as many discrete variables that comprise the calculations themselves. These variables, in turn, are rarely fixed or definitive; instead, they’re subject to interpretation and subjectivity, which compounds the overall difficulty in finding a cost of capital as it requires experience, finesse, and (often) an “informed guess” about the future.
Before diving into the cost of capital, though, we need to define the term in an overall valuation framework. At its core, the cost of capital is an exchange of risk and reward. It’s represented by a defined return investors expect in exchange for the investment risk. For example, if a firm’s cost of capital is 10%, investors expect a 10% return on their investment after the business has reinvested to ensure the sustainability of its performance or the achievability of its business plan. In this context, it’s reasonable to assume that as risk increases, so too does the expected return, but it doesn’t mean investors should pick a project or investment with the highest cost of capital by default. Since the higher return is in exchange for risk, there is a greater likelihood of the investment failing to meet the expected returns or losing the invested principal itself.
Weighted Average Cost of Capital
Capital Structuring
In cost of capital, capital refers to the firm’s overall capital structure or the amount of debt and equity the company uses to finance itself. Firms raise capital via equity issues (selling shares/ownership stakes in the company), or assuming debt (through loans or issuing bonds). From this premise, three distinct costs of capital exist:
- Cost of common equity: the rate of return common stockholders demand in exchange for financing.
- Cost of preferred equity: the same, but for preferred equity investors.
- Cost of debt capital: often easiest to calculate, the cost of debt is typically either the interest paid when servicing loan debt or the coupon rate paid to bondholders.
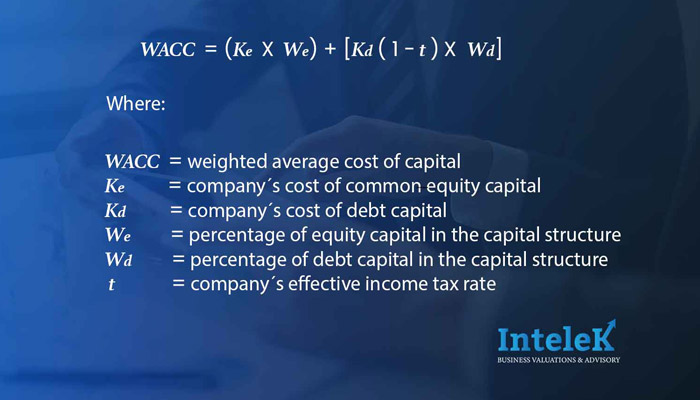
These three costs of capital converge into a single formula when calculating the weighted average cost of capital (WACC). The WACC is a common, simplified way of calculating the overall cost of capital.
Drawbacks
Academia often heralds the WACC as a primary method for calculating cost of capital. However, it is only functionally valuable in a vacuum environment with predefined variables and has serious flaws when exposed to the messiness of the real world:
- Analysts must choose whether to calculate the leverage ratio today or project what the firm sees as its ideal future debt-to-equity weights; using future projections is best when assessing an investment’s long-term viability, but it can result in a too-optimistic assessment.
- Accurately gauging debt and equity weights can be complex, especially when valuing private companies without the luxury of having financial statements freely available. To compensate, analysts and investors use average industry weights as a proxy.
Finally, accurate and realistic estimations of the cost of equity are very challenging for even experienced analysts. Because of this difficulty, there are different methods to calculate the cost of equity.
Cost of Equity Capital
The primary formula undergirding most cost of equity estimates is simply the sum of a risk-free interest rate and a premium for risk above the risk-free rate. With these underlying metrics, diverse methods incrementally build upon them by adding additional variables and data points as the calculation requires.
Capital Asset Pricing Model (CAPM)
The capital asset pricing model (CAPM) is, like the WACC, a mainstay of financial theory but doesn’t always hold up under practical scrutiny. CAPM falls under the broad umbrella of capital market theory which describes how investors should behave given a set of ideal circumstances, assuming that:
- Investors are risk-averse.
- Investors will develop fully diversified portfolios that are maximally efficient (balance reward and risk).
- The time horizon, or investment holding period, is standardized across all market participants.
- Variable expectations, like the expected rate of return for an investment, are likewise standardized.
- Transaction costs and investment-related taxation is nonexistent.
- Lending and borrowing rates are the same.
- The market is perfectly liquid and divisible – an investor can sell any sized fractional slice of an investment anytime.
Assuming these to be true, we calculate the expected return of an asset (cost of equity) via:
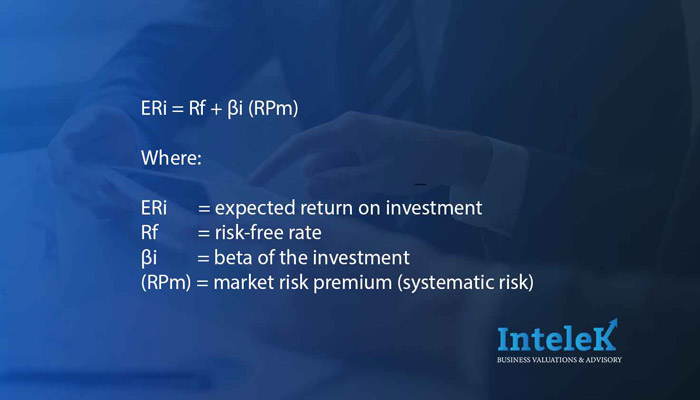
Great in theory, of course. But subjective reality consists of many additional variables, so the totality of the CAPM’s applicability stops there. Additionally, beyond the core issue of dealing with optimal circumstances:
- Beta, as a singular proxy for risk, doesn’t account for risk’s diverse types and effects.
- Risk-free rates rarely stay constant over the life of an investment.
- Like the inability of the beta to act as an accurate solo barometer for risk, the risk and return of an investment rarely converge along a linear axis in real life.
Because of these and other shortcomings in the CAPM, alternative methods must pick up the slack and make the transition into reality.
Modified CAPM
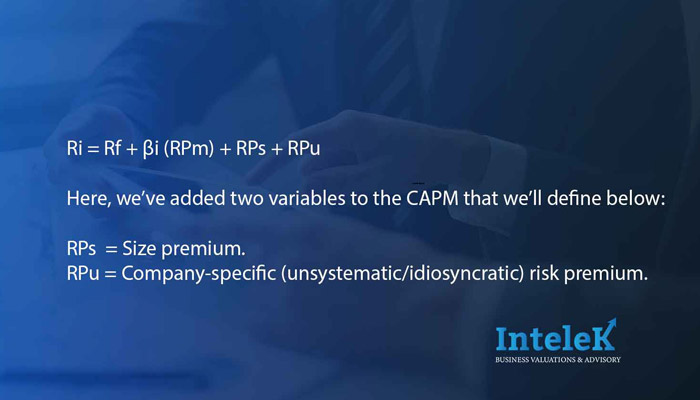
An equally simple but widely-accepted alternative to a cost of equity capital calculations via CAPM is the modified CAPM (MCAPM). The MCAPM is structurally the same calculation as the CAPM with the addition of two new variables to better reflect reality:
Build-Up Method
As the name implies, the build-up method continues to expand upon a baseline cost of equity capital calculation by building upon it with new variables to increase specificity. The build-up method, therefore, views the central risk premium as a sum of many parts; each of these parts represents the reward for an investor taking on that individual risk. Knowing this, we seek to define each of those risks, which include:
- Equity/market risk premium: return for investing in the overall stock market; the difference between market returns and the risk-free rate.
- Industry risk premium: the relative risk of the specific industry.
- Size premium: a return for investing in smaller, less-established companies.
- Company-specific risk premium: the return for undiversified investing in a specific company; exposure to unsystematic/idiosyncratic risk.
The build-up method, taking one or all these subcomponents of risk, adds them to the risk-free rate to determine the required return:
ERi=Rf+RPm+RPi+RPs+RPu
Where the new variable, RPi, is the industry risk premium.
Core Components in Cost of Equity Capital
Having defined three primary means of calculating the cost of equity capital, we’ve thrown out a few common variable names across all three, with some unique to the MCAPM and build-up method. But, as we said at the beginning, knowing these variables and what value to assign them is as much art as science. It requires a thorough understanding of investing, market conditions, and the underlying “first principles” of the variables.
Risk-Free Rate
The risk-free rate represents the return an investor would get from, as the name implies, a “riskless” investment. Since actual risk-free investments don’t exist, analysts and investors use the next best thing – US Government Treasuries.
We use US Treasuries because there is effectively no possibility of default, as the government can always raise taxes to pay its debt. And, if the US government did default on its debt obligations, there would be much more significant concerns than precisely calculating a cost of equity.
As a rule, investors use the spot yield to maturity on a 20-year Treasury bond or a bond whose maturity matches the expected length of the investment. While short-term T-Bills are arguably better proxies for a riskless asset, their time horizon is too short to be effectively married with longer-term investment in a cost of capital calculation.
Equity Risk Premium
The equity risk premium (ERP), or market risk premium, is the return investors demand for broadly investing in the stock market. Because it is the risk of investing in stocks, rather than simply parking cash into a risk-free asset, we find the ERP by subtracting the risk-free rate from an expected market return.
ERP can be difficult to calculate as it is effectively a forward-looking metric. Unable to predict the future, we often rely on past performance indicators or unsure projections as a proxy. Therefore, investors and analysts usually use one of two methods:
- Ex-post approach: ERP as a function of simple or compounding returns over a selected historical period.
- Ex-ante approach: ERP as a function of expected future stock prices and dividend distributions.
Regardless of the selected approach, many fine details must be accounted for when calculating an ERP, and amateurs often find themselves in a “paralysis by analysis” scenario.
Beta and Systematic Risk
The simple CAPM assesses risk solely as a function of beta, or the company’s risk, compared to market risk measured by volatility. The CAPM, therefore, only regards risk as systematic and disregards all unsystematic or idiosyncratic risks like industry, firm-specific, and others.
The beta is calculated by comparing the volatility of a stock against the overall market. A benchmark’s returns, like the S&P 500, typically act as a stand-in for the latter. The market beta, by definition, is 1. So, any stock with a beta above 1 is more volatile/riskier, and under 1 is less risky.
Beta calculations are often either directly calculated, using regression analysis, or calculated by proxy via comparison with similar companies. The latter is common when estimating beta for a private company without an easily accessible metric like stock price to compare against the market.
Industry Risk Premium
Found as a subset of risk premia in the build-up method, the industry risk premium (IRP) adds to a basic beta by accounting for risk differences across industries, i.e., the broad tech sector is riskier than the overall utilities sector. Including the IRP in a comprehensive risk calculation through the build-up method, therefore, lets investors compensate for additional risk taken relative to the market (as in tech stocks) or tamper the end cost of equity capital if the industry is traditionally less risky than the overall market.
Size Premium
Found in both the MCAPM and build-up methods, the size premium compensates investors for the risk taken by investing in smaller companies or modifies the risk downward if investing in a larger firm. Multiple studies and meta-analyses support the thesis that smaller companies return greater rewards in exchange for increased risk. This research accounts for “size” through market value, book value, net incomes, sales, employee headcount, and more; all variables studied ultimately support the size supposition.
Company-Specific Risk Premium (CSRP)
Innumerable factors, known and unknown, increase the idiosyncratic or unsystematic risk of investing in an individual company. The company-specific size premium (CSRP) is used in the MCAPM and the build-up method to quantify at least a portion of the overall idiosyncratic risk to clarify overall risk better. Three core components typically comprise the CSRP assessment, although all three are somewhat illusory, flexible, and difficult to define definitively:
- Company leverage.
- Earning volatility or cash flow volatility (unforecasted).
- Other factors include, but are certainly not limited to:
- Management depth and expertise.
- Capital access and liquidity.
- Customer concentration, loyalty, and stability.
- Current competitive outlay and threat of new entrants in the market.
- Supplier relations.
- Legal and regulatory environment.
- And more!
In short, the CSRP takes a holistic, company-wide view beyond simply financial management and engineering to pin down the potential effects of typical (and atypical) operational risk for that specific investment.
Summary
Estimating the cost of capital is a critical step in any valuation process and it implies a lot of subjectivity and professional judgment. Albeit it might seem that there are simple formulas available, all the inputs are uncertain and in some cases erratic. Understanding the cost of capital, its advantages, and its pitfalls will allow for better decisions while considering different risk/return scenarios.